Turning your annual report into infographics to boost visibility and engagement
How Pinion visually represented its wins to engage stakeholders around the business.

Annual reports are not often the sexiest of documents—especially to busy employees who aren’t focused on firm strategy so much as serving clients and engaging in urgent work projects.
As leading food and agriculture consulting & accounting firm KCoe Isom (now Pinion) worked its way through a tough year in 2020 (didn’t we all?), Internal Communications and Events Director Debra Helwig knew that the firm needed a way to visually represent all the incredible work her colleagues did in the face of insurmountable challenges.
That’s when she came up with an idea of creating an infographic timeline to capture the firm’s successes in the face of adversity.
“A timeline like this is the ultimate engagement tool, because it’s not about making you feel good about yourself and good about being here, but feeling good about what we’ve accomplished together,” Helwig said. “It’s self-actualization, combined with firm actualization, combined with real numbers and real results. And it’s done in a way that people can choose how they engage, in a way that’s pleasing to them whether they operate as a visual or kinesthetic learner.”
Presenting success alongside struggle
The project began in 2020 with a timeline of things happening nationally month by month, laid over a line documenting the number of COVID cases per day.
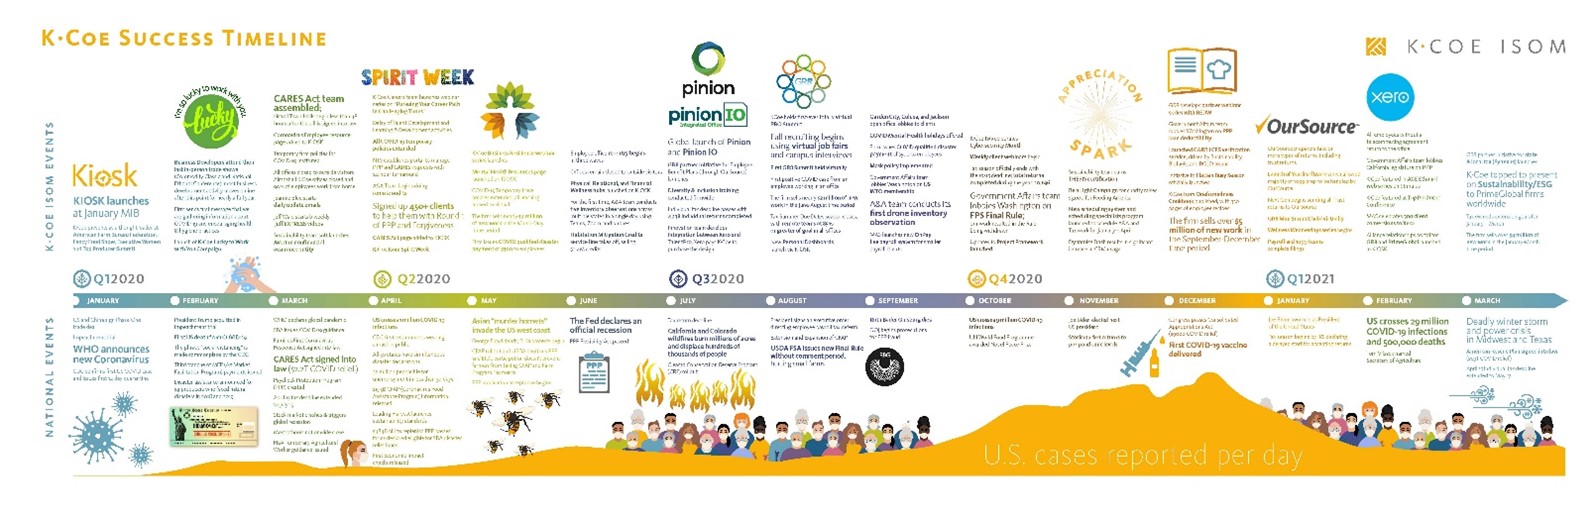
A snapshot of KCoe Isom’s timeline from 2020, designed by Lorin Yeater (courtesy of Pinion)
“The top line affirmed all the things we accomplished while COVID unfolded around us,” explained Helwig. “We could show that the month the US experienced Asian Murder Hornets, the firm launched a mental health resources page on our intranet, as well as a business resilience webinar series. We didn’t let the chaos of the world around us slow us down.”
This presentation laid the drama bare without the firm needing to editorialize. The ability to juxtapose its wins alongside what was going on in the world said enough.
Happy New Gear
After 2020, the firm rebranded as Pinion but found value in keeping this tradition of visualizing its annual review. Having some fun with its gear logo, Pinion began to brand the start of its fiscal year on April first with a “Happy New Gear” campaign. Pinion’s Internal Communications team used this “New Gear” concept thematically over a period of six weeks to frame its look back at the previous year and create momentum for the fiscal year to come.
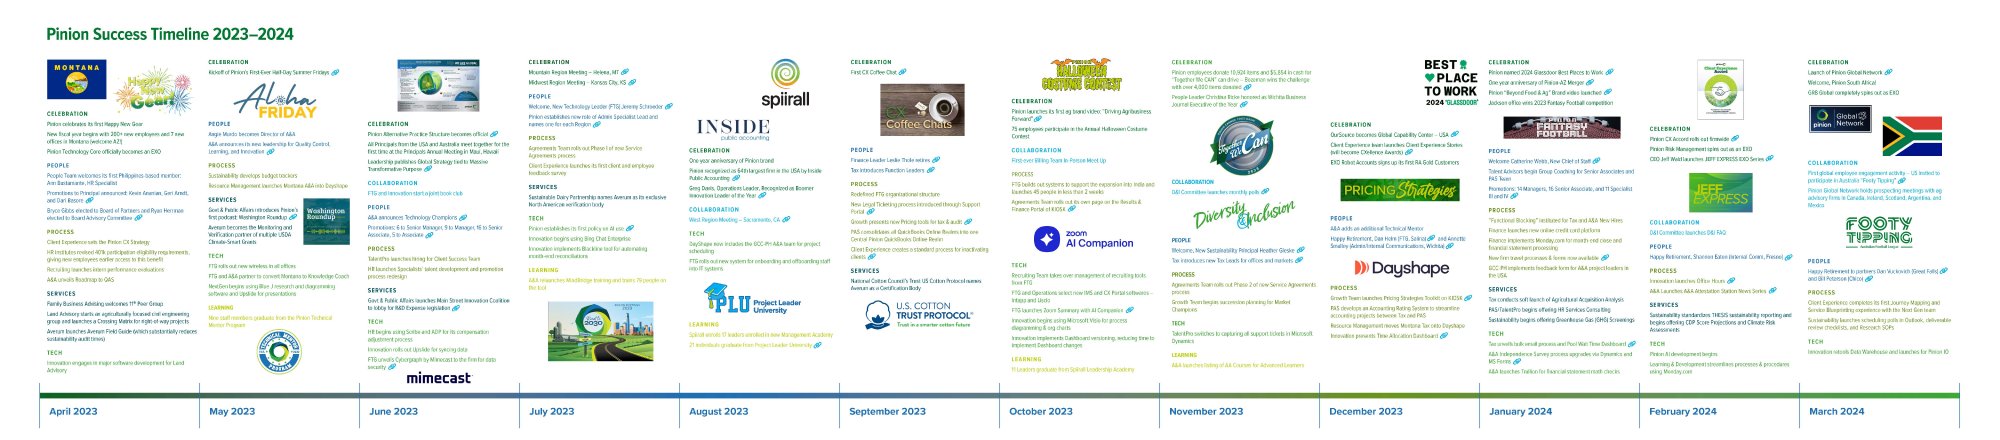
A snapshot of Pinion’s Success Timeline from 2023-2024, designed by Bill Rogers (courtesy of Pinion)
Helwig intentionally divided all major employee and corporate initatives over a 12-month period in an easy-to-digest manner, bucketing successes into:
- Celebration
- Collaboration
- People/Process/Services
- Technology
- Learning
“Every organization will likely have their own distinct buckets for content,” said Helwig. “The ones we chose align with the mission, vision, values, and culture pillars we use to define our business growth and success.”
Visibility fosters recognition
By showcasing the breadth of Pinion’s efforts across operations and business lines, Helwig’s infographics create visibility that doubles as recognition. Being able to see D&I milestones alongside new pricing strategies and fantasy football, or the spinning out of an exponential organization alongside the launch of a global network, showcases how each effort coexists and contributes to a larger narrative of success.
“Sharing successes in this way matters because we get to the end of a fiscal year and people think of profitability and success in terms of number of clients, types of projects, or revenue,” said Helwig. “They pick two or three KPIs and determine in their minds whether or not we had a good year based strictly on those KPIs. The problem is, if you think that narrowly, you invalidate the infrastructure work that prepares you for a bigger future. The timeline reminds us that not all our important efforts have an immediate impact – but they are still critical and worth celebrating.”
Helwig believes that many companies make a mistake of not realizing the work they do today won’t necessarily give them results in the same fiscal year.
“We bought software, we changed processes. We had some key retirements and new additions. We established our first policy on AI use and rolled out our own AI tool,” she continued. “We’re not going to necessarily see client or financial results from those efforts immediately, but if we look back over the course of the year, people can see everything we accomplished. It helps us move into the exponential future we desire. And that’s motivating.”
Segmenting stats into digestible pullouts
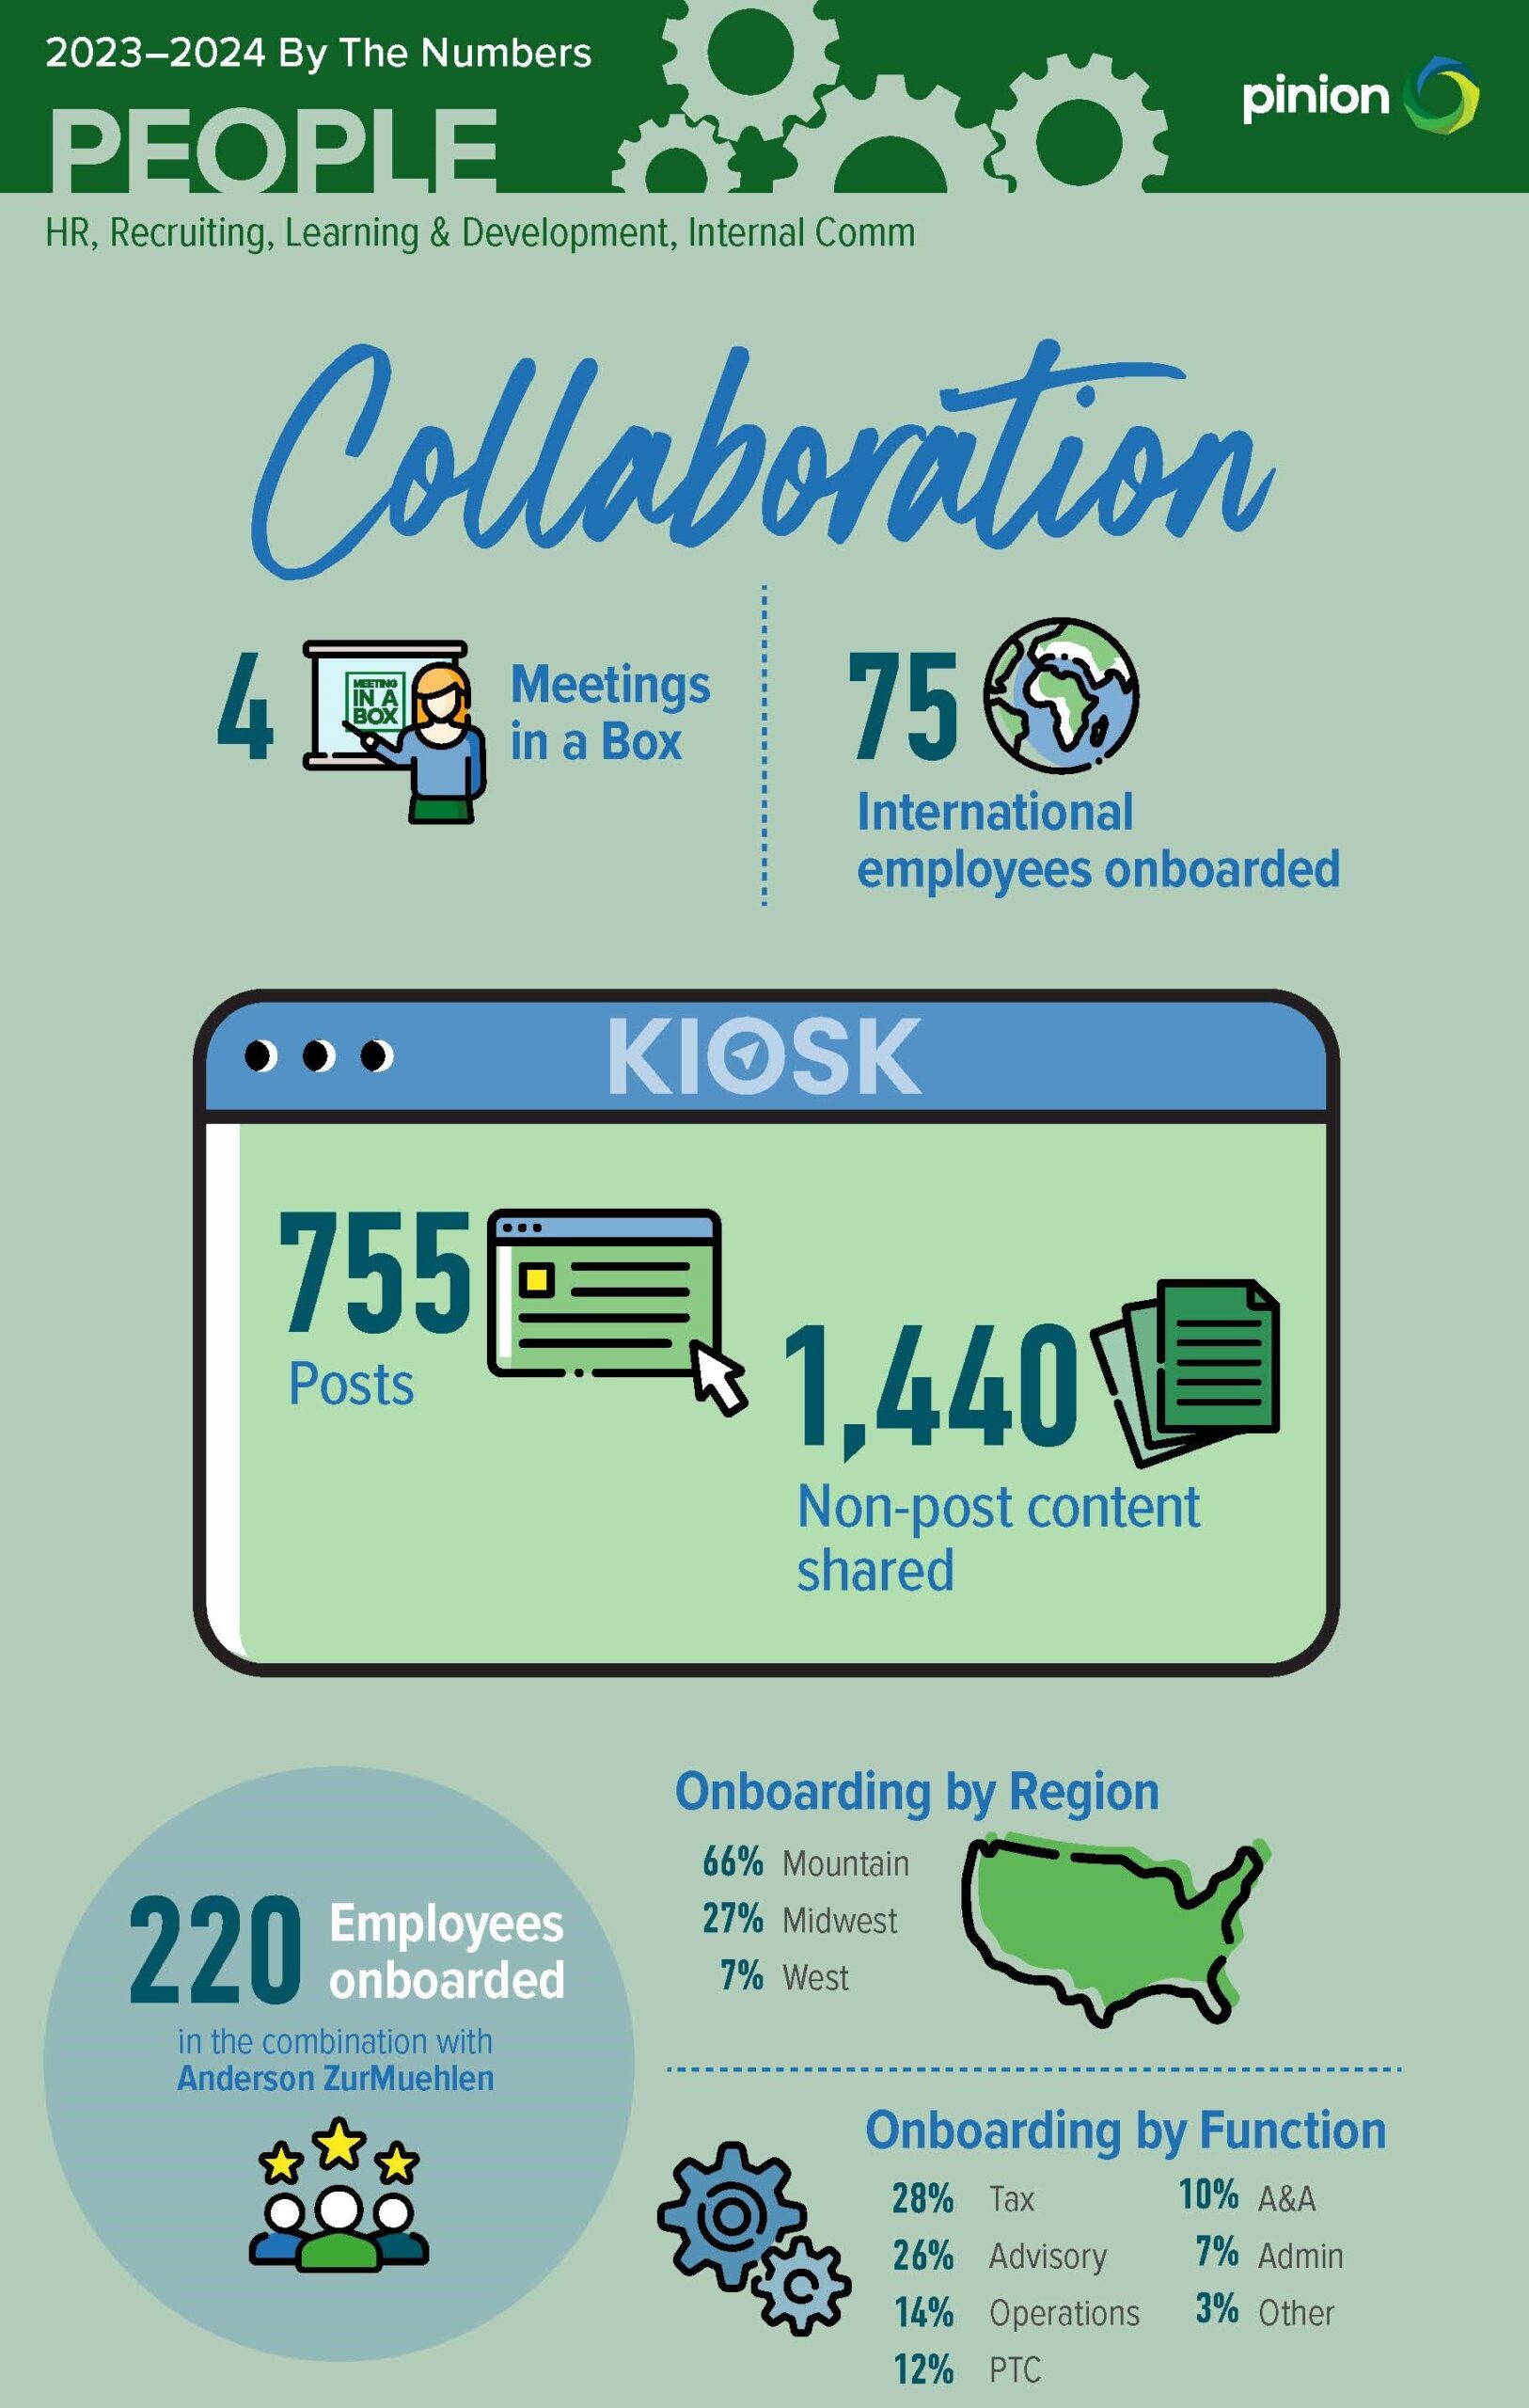
A portion of the People infographic, designed by Bill Rogers (courtesy of Pinion)
While Pinion began this process with a timeline, the firm soon got more granular with dedicated numerical infographics that present stats pertaining to specific wins. Dubbed “By the Numbers,” Pinion produces five of these infographics — one for People, one for Operations, one for Growth and one for each of its two main business lines (Tax & Attest and Advisory).
“The Success Timeline is a list of initiatives, but the infographics are numerically driven,” explained Helwig. “Percentages. The number of people we onboarded. This is an exercise in putting our money where our mouth is by saying, ‘This is what we say our values are, this is what we say our culture is, and this is how we lived it this year’—then providing the data to back that up.”
A legacy view of operations
As Pinion showcases one of these infographics every week for five weeks, an incredible employer brand opportunity emerges. “People are getting these infographics as a drip, so the metrics of our success are in front of them all the time,” Helwig said.
“We announced the ‘Happy New Gear’ series at an all-hands meeting, told people it was coming and got them hyped up to look for the timeline and infographics. We’re getting comments on our intranet as we continue to publish them.”
A splash banner goes up on the intranet with each post. When employees open a post, they can go back and review everything that came before, allowing them to come back and engage with the material again and again.
Pinion’s future plans include aggregating all of the pieces into its intranet operations portal, “Get to Know Pinion,” as a kit that can be used for employee recruiting and onboarding efforts. It will also be used by Pinion’s CEO when he’s having conversations with potential candidates for M&As.
“We’re creating a legacy view of our operations,” Helwig said, “so we can be a future-focused firm.”